Most money transfer operators can name their top corridor by volume without hesitation. Very few can tell you which corridor is actually making them money. That gap — between what you're processing and what you're keeping — is not just an analytics problem. It's a business survival problem. In an industry where margins are thin, compliance costs are rising, and competition is intensifying, building your growth strategy on volume metrics alone is like navigating by a compass that only points in one direction. This guide breaks down the real economics of corridor profitability — and how MTOs can start measuring what actually matters.
In This Article
Volume is seductive. When a corridor processes £2 million a month, it feels like success. It fuels conversations with investors, justifies headcount, and gives leadership a clear metric to celebrate. But volume is a vanity metric if it isn't paired with a clear understanding of what margin that corridor is generating per transaction.
The remittance industry has historically been built on volume thinking — grow the flow, grow the revenue. But as the sector has matured, with neo-remittance players compressing pricing, regulators increasing scrutiny, and payout partners renegotiating terms, the old model of "process more, earn more" is no longer reliable. What's replacing it is a margin-first operating philosophy that profitable MTOs are quietly adopting while others struggle to understand why their growth isn't translating into profitability.
The fundamental issue is measurement. Most MTO operators track revenue per corridor based on the FX spread and fee collected at point of sale. What they don't systematically track is the full cost stack on the payout side — the landed cost that only becomes clear when you account for every deduction, delay, exception, and failed transaction in that corridor. When the true cost stack is laid against the revenue captured, many corridors that look healthy on a dashboard are quietly eroding profitability each quarter.
Figure 1: How volume-first and margin-first MTOs approach corridor performance differently
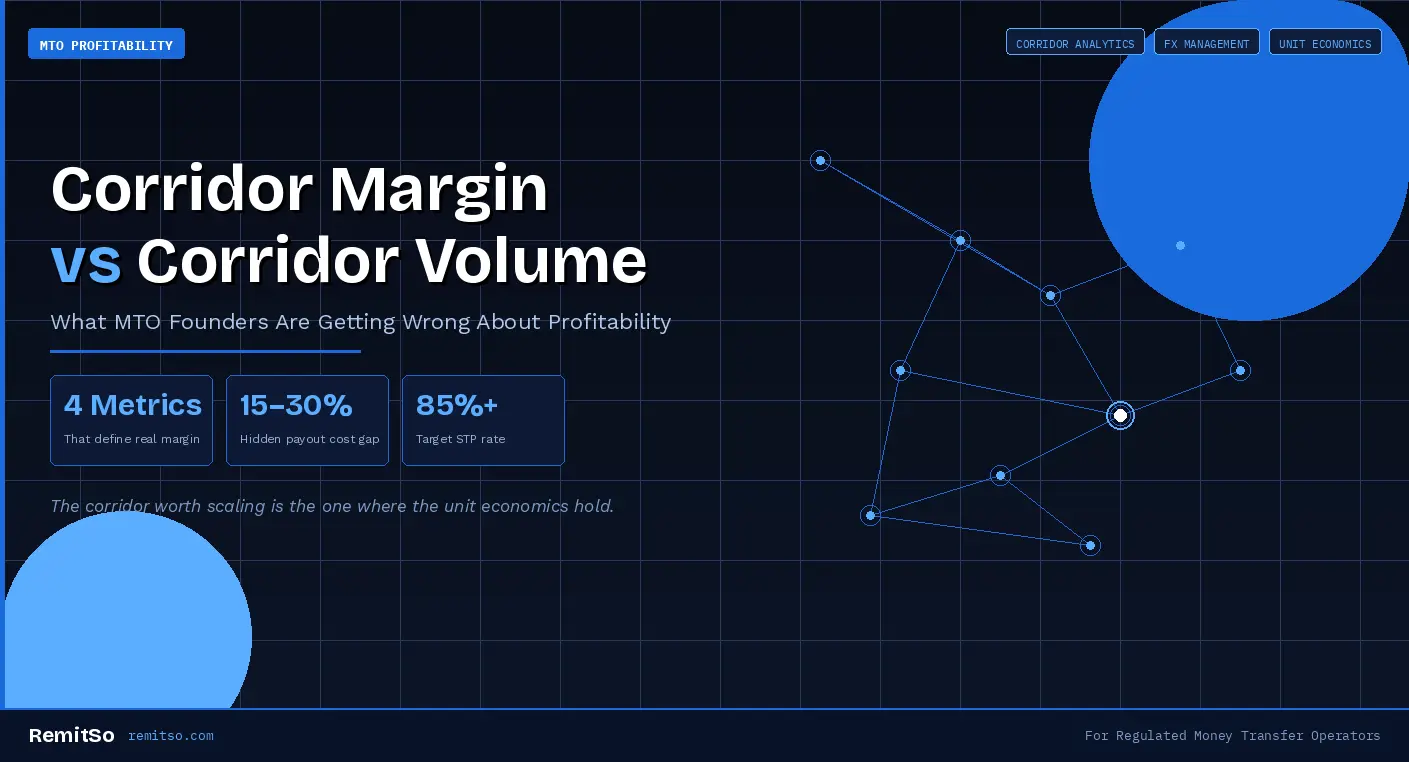
Profitable corridor management comes down to four metrics that, when tracked together, give you the real picture of what a corridor is earning — and what it's costing. These aren't new concepts, but very few MTOs track all four in a structured, corridor-level reporting framework. Here is what each one means and why each one matters.
Figure 2: Four metrics every MTO must track to understand true corridor profitability
The first and most commonly misunderstood metric is the true landed payout cost. When an MTO onboards a payout partner, they negotiate a rate — often expressed as a percentage or a fixed fee per transaction. That headline rate becomes the baseline assumption in their unit economics model. But the headline rate is rarely what the MTO actually pays.
Between the negotiated rate and the actual cost per transaction sits a layer of charges that accumulates quietly and often goes untracked. Minimum volume commitments that result in penalty charges when transaction flow dips. Settlement fees applied per batch. Exception-handling charges when transactions fall outside standard processing parameters. Currency conversion charges embedded in the settlement rate rather than declared separately. Reconciliation discrepancies that are small per transaction but significant at scale.
The operational discipline required to track true landed cost is straightforward in principle: for every corridor, every month, total all charges associated with payout delivery and divide by total transactions successfully paid out. The result — cost per completed transaction — should then be mapped against the revenue captured per transaction in that corridor. The delta is your real margin. In practice, most MTOs lack the reporting infrastructure to do this at corridor level without significant manual effort, which means the calculation simply doesn't get done, and the margin assumption from launch day persists long after reality has moved on.
Figure 3: Common hidden cost components inside payout partner agreements that inflate true landed cost
The second metric is the manual handling ratio — the percentage of transactions in a corridor that require human intervention at any point between initiation and completion. This is one of the most undertracked cost drivers in MTO operations, and it has a compounding impact on margin that goes far beyond the obvious.
A transaction that flows straight through — from customer initiation, through compliance screening, through payout partner processing, to completion — costs a predictable and relatively low amount to process. Once a transaction requires manual intervention, that cost profile changes dramatically. Compliance holds for enhanced due diligence. Payout failures requiring re-routing through an alternative partner. Customer service contacts from recipients chasing delayed payments. Internal operations staff time to investigate and resolve. Each of these adds a time cost and a labour cost that is real but invisible in a standard transaction-level report.
What makes manual handling ratio particularly important as a margin metric is that it interacts with all other costs. A corridor with a high manual handling ratio will also show inflated customer acquisition cost, higher payout partner charges, and reduced FX performance — because delays create additional exposure to rate movement between booking and settlement. Fixing the manual handling ratio in a corridor doesn't just reduce operational cost — it creates a positive chain reaction across the entire margin stack.
Figure 4: Estimated cost impact of manual handling on MTO per-transaction economics
Foreign exchange margin is the revenue engine of most MTOs. But FX management is also where some of the most common strategic mistakes are made — particularly in how MTOs respond to margin pressure in a corridor.
When an MTO detects that a corridor is underperforming on margin, the instinctive response is often to widen the FX spread. It's the lever with the most direct and immediate impact on per-transaction revenue. The problem is that it also has the most direct and immediate impact on competitiveness. In corridors where price comparison is common — and in the smartphone era, this is virtually every corridor — widening the spread drives rate-sensitive customers to competitors. The result is a paradox: the MTO earns more per transaction but processes fewer transactions, and may end up earning less in total while simultaneously becoming less competitive.
| Dimension | The Spread Trap (Reactive) | Structured Pricing (Proactive) |
|---|---|---|
| Margin Protection | Reactive — widen spread when margin drops | Proactive — model margin before pricing decision |
| Competitiveness | Erodes — rate becomes uncompetitive at scale | Maintained — rate benchmarked against corridor competitors |
| Risk Management | Bundled — risk buffer mixed into customer rate | Separated — risk reserve managed as treasury function |
| Volume Impact | Negative — rate-sensitive customers defect | Positive — competitive rate drives volume retention |
| Margin Outcome | Declining — less total margin as volume falls | Sustainable — margin protected without volume sacrifice |
Figure 5: Comparison of reactive vs. structured FX spread strategies and their corridor-level impact
The fourth metric — and the one most consistently ignored in corridor profitability analysis — is the settlement cycle and its associated capital lock-up cost. This is the cost of the float: the working capital tied up between when you collect funds from the sender and when you receive settlement from your payout partner.
Settlement cycles in remittance corridors vary enormously. In some corridors, partners settle daily. In others, settlement occurs weekly or even fortnightly. In high-volume corridors, the difference between a 24-hour and a 7-day settlement cycle can represent hundreds of thousands of pounds in working capital permanently tied up in the pipeline. That capital has a cost — whether it's the interest on the credit facility used to fund it, the opportunity cost of capital that could be deployed elsewhere, or the constraint it places on growth capacity in other corridors.
When evaluating corridors for scale investment, settlement cycle should be a first-order consideration, not an afterthought. A corridor with slightly lower headline margins but daily settlement may generate better returns on capital than a higher-margin corridor with weekly settlement — because capital velocity makes the lower-margin corridor more efficient on a return-on-capital basis.
With all four metrics in view — true landed payout cost, manual handling ratio, FX performance over time, and settlement cycle — you can construct a unit economics model for each corridor that gives you a defensible answer to the most important strategic question in MTO operations: which corridors are worth scaling?
The answer is almost never simply "the corridors with the highest volume." Volume is a function of demand — which is a market characteristic you inherit, not create. Margin per transaction, on the other hand, is a function of operational efficiency, partner management, pricing discipline, and technology infrastructure — all things an MTO can actively improve. The corridors worth scaling are those where the unit economics hold, and ideally improve, as transaction volume grows.
Scale creates leverage in some cost categories. A higher-volume corridor gives you negotiating power with payout partners on both rate and settlement terms. It enables investment in automation that reduces manual handling ratio. It provides more data for FX risk management. But scale also amplifies weaknesses. If the true landed cost is wrong at low volume, it becomes more wrong at higher volume. If the manual handling ratio isn't tracked, scaling a corridor with a 30% exception rate simply means scaling your operational cost burden proportionally.
If you've recognised any of the patterns described above in your own operation, the right starting point is a structured corridor profitability audit. This doesn't require a major technology investment or a team of analysts — it requires a rigorous process applied consistently across your active corridors.
Figure 6: Six-step framework for conducting a corridor profitability audit in any MTO operation
One of the practical barriers to implementing the kind of corridor profitability framework described in this article is data infrastructure. For many MTOs, transaction data, payout partner statements, compliance logs, and FX records live in separate systems — often partially manual — making corridor-level profitability analysis a labour-intensive exercise that gets deprioritised in favour of operational urgencies.
If you're looking to build or scale a money transfer operation with the financial visibility that real corridor management requires, RemitSo's platform is built specifically for regulated MTOs who need operational infrastructure that surfaces the economics of their business — not just the volume. From payout partner management and FX handling to compliance workflow and transaction reporting, RemitSo gives operators the data foundation needed to make margin-first decisions at scale.
Corridor margin is the net revenue an MTO retains per transaction in a specific send-receive corridor after all costs are deducted — including the payout partner's true landed cost, operational costs for manual handling, FX-related costs, and the cost of capital tied up in the settlement float. It is distinct from corridor volume, which simply measures the total value or number of transactions processed. Most MTOs optimise for volume; profitable MTOs optimise for margin.
Volume is more immediately visible and easier to measure than true margin. Most MTO dashboards surface transaction counts and total value processed by default. Margin requires reconstructing cost data from multiple sources — payout partner statements, compliance systems, and operational logs — which many MTOs lack the infrastructure to consolidate consistently at corridor level. As a result, the margin calculation simply doesn't get done, and launch-day assumptions persist long after reality has moved on.
The headline partner rate is the stated rate agreed with a payout partner at contracting. True landed payout cost is the actual cost per successfully completed transaction, incorporating all charges — including volume minimums, penalty fees, settlement batch charges, exception handling fees, and any FX conversion costs embedded in the settlement rate. The difference between the two can be 15–30% or more, particularly for MTOs with variable volume patterns or above-average exception rates.
Industry benchmarks suggest that a well-optimised corridor should achieve STP rates of 85% or above. Corridors with STP rates below 80% typically indicate systemic issues in compliance rule calibration, payout partner data requirements, or customer data quality at point of capture. Each percentage point of STP improvement reduces the operational cost per transaction across the entire corridor and creates positive downstream effects on customer satisfaction and FX exposure management.
Widening the FX spread increases revenue per transaction in the short term but typically reduces competitiveness in the corridor. Rate-sensitive customers — who make up a large proportion of remittance senders in corridors with active price comparison behaviour — will migrate to lower-cost alternatives. The result is a reduction in transaction volume that often outweighs the per-transaction revenue gain, producing a net decline in total corridor margin despite the higher spread. The better approach is to separate the customer-facing rate from the internal risk reserve.
Settlement cycle determines how much working capital is permanently tied up in the transaction pipeline between collection from senders and receipt of funds from payout partners. Longer settlement cycles require more float, which has a real cost — either in credit facility interest or in opportunity cost of capital. In high-volume corridors, the difference between daily and weekly settlement can represent a significant capital requirement that affects both profitability and growth capacity. Under FCA and equivalent frameworks, long settlement cycles also directly affect capital adequacy calculations.
Scaling decisions should be based on unit economics, not volume. The corridor worth scaling is the one where the four-metric profitability model — true landed cost, manual handling ratio, FX performance, and settlement cycle cost — produces positive and defensible margin per transaction that holds or improves as volume grows. Before committing to scale, apply the model at target volume and stress-test it with a 20% degradation in payout partner terms and a 10% increase in manual handling ratio. If the corridor remains profitable under that downside scenario, it is a genuine scale candidate.
A corridor profitability audit requires four categories of data: revenue data at transaction level (fee and FX spread per transaction, per corridor); payout partner statements including all line-item charges for the audit period; transaction processing logs identifying which transactions required manual intervention; and settlement term documentation showing cycle length and float-related costs. Most MTOs have this data distributed across multiple systems. The audit process requires consolidating it into a single corridor-level view — ideally automated through your core platform.